Illustrative Model
How we underwrite a $10 million small-bay acquisition.
A worked example of method — the assumptions we test, how they flow through five years of operations, and what moves the answer. The asset is hypothetical.
Please read first
This is a hypothetical illustration, not a projection and not an offer. It describes no actual, completed or contemplated investment. The property, rents, financing and outcomes are invented for the purpose of showing how we approach underwriting. Real assets differ in every respect that matters.
The figures are not targets, forecasts, guarantees or indications of future performance, and they are not the terms of any offering. Real estate investment involves risk, including loss of principal. Nothing here constitutes investment, legal, tax or accounting advice. See our Disclosures.
The Hypothetical Asset
A 65,600 SF park, 26 units, at a $152.44/SF reference basis.
A hypothetical, illustrative property — not owned, under contract or contemplated. Modelled as an under-managed park in an illustrative secondary Sun Belt industrial market, with in-place rents below market and occupancy a professional leasing effort should be able to lift.
- Purchase price
- $10,000,000
- Building area
- 65,600 SF
- Price per SF
- $152.44
- Units
- 26 units, 2,523 SF average
- Occupancy at close
- 85%
- In-place rent
- $13.45 / SF NNN
- Market rent
- $15.95 / SF NNN
On the acquisition basis
For this illustration $152.44 per SF is used as a reference acquisition basis. It is anchored on CBRE's reported average of $152.42 per SF across 2,504 owner-occupier purchases of facilities of 10,000 SF or more in 2024 (+5% year over year).
It is not a universal benchmark. Actual pricing varies materially by market, submarket, building age, condition, bay configuration, occupancy and tenant profile. That CBRE figure also covers owner-occupier purchases, which is a different buyer population from an investor. A basis range is shown further down for exactly this reason.
Source: CBRE, “More Occupiers Opting to Buy Industrial Facilities” , March 24, 2025.
On the rent assumption
In-place rent of $13.45 per SF against market rent of $15.95 per SF implies roughly 18.6% mark-to-market potential over the hold.
That spread is an assumption, not an observation. Rents vary by market and submarket, and a mark-to-market case has to be validated asset by asset against comparable leasing evidence — actual signed rents on comparable units, not asking rents. Where the evidence is not there, the spread does not exist.
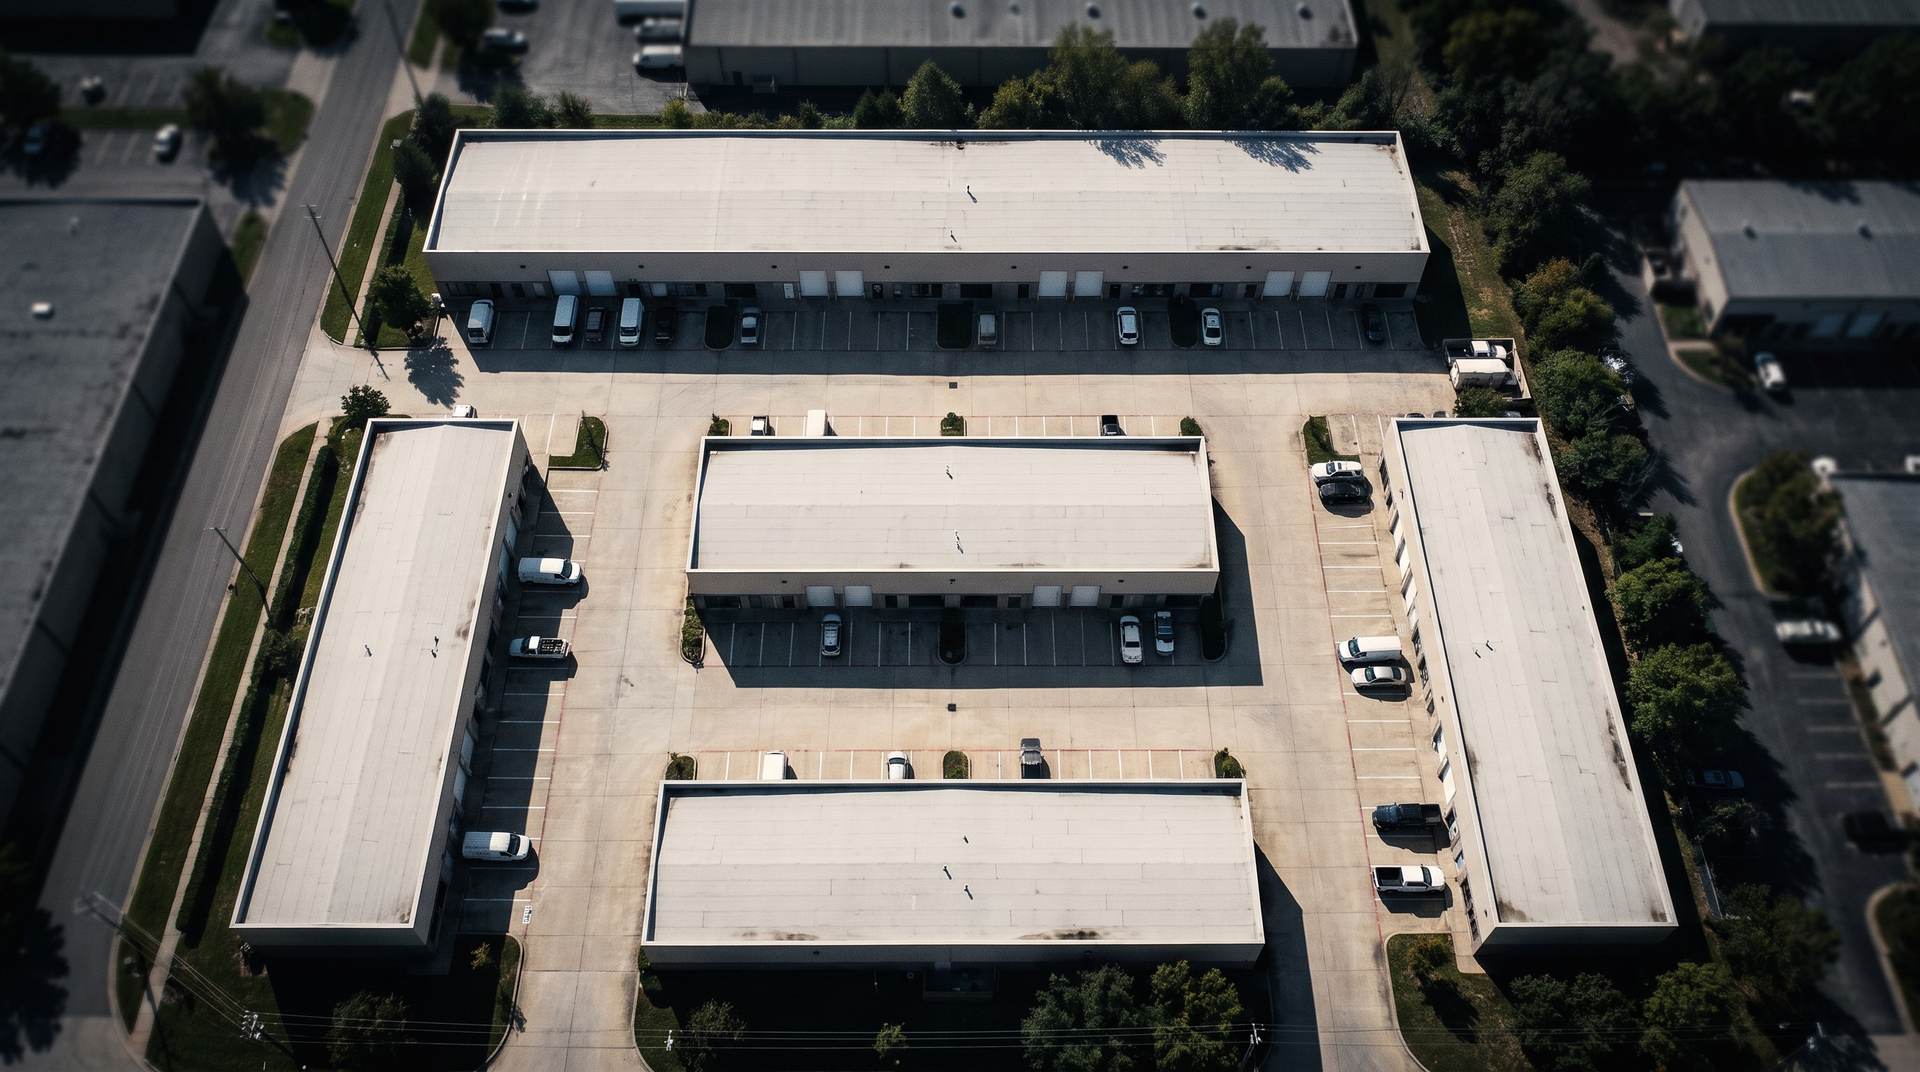
The Asset
Hypothetical: a 65,600 SF small-bay park across 26 units.
Sources & Uses
Total capitalisation of $11,038,800.
The purchase price is not the cost. Acquisition costs, the capital programme, leasing costs and reserves all have to be funded on day one.
Uses
- Purchase price
- $10,000,000
- Acquisition costs (2%)
- $200,000
- Capital improvement programme ($7.50/SF)
- $492,000
- Tenant improvements & leasing ($3.00/SF)
- $196,800
- Working capital & reserves
- $150,000
- Total capitalisation
- $11,038,800
Sources
- Senior debt (60% LTV)
- $6,000,000
- Equity
- $5,038,800
- Total sources
- $11,038,800
Debt terms
- Loan-to-value
- 60%
- Interest rate
- 6.50%
- Structure
- 3 years interest-only, then 30-year amortisation
- Interest-only payment
- $390,000 / year
- Amortising payment
- $455,089 / year
Operating Expenses
What the 8.0% expense load actually contains.
Small-bay industrial is operationally intensive — more leases, more renewals, more collections. A single blended percentage is easy to wave through, so here is what sits inside it.
- Property management
- 3.5%
- Non-recoverable operating
- 2.0%
- General & administrative
- 1.0%
- Credit loss & turnover
- 1.5%
- Total, as a share of gross rent
- 8.0%
Third-party or in-house management of a 28-unit rent roll.
Structural repairs, capital-adjacent items and vacant-unit costs that cannot be billed back.
Accounting, legal, insurance administration and reporting at the asset level.
Bad debt and downtime between leases across a granular, small-tenant rent roll.
Recovered from tenants under NNN
- Real estate taxes
- Property insurance
- Common-area maintenance
- Utilities where separately metered
These sit outside the load above because the leases pass them through. Recovery is never complete in practice — vacant units have no one to bill, which is why vacancy carries an expense cost as well as a revenue cost.
Operating Schedule
Five years of operations.
Base case. Occupancy climbs from 85% to 94% as units are improved and re-leased; average achieved rent rolls from $13.45 toward market. The expense load is held at 8.0% of gross rent throughout — broken out above.
Scroll the table
| Year | Occupancy | Leased SF | Rent / SF | NOI | Debt service | Cash flow | CoC |
|---|---|---|---|---|---|---|---|
| Year 1 | 85% | 55,760 | $13.45 | $689,974 | ($390,000) | $299,974 | 6.0% |
| Year 2 | 90% | 59,040 | $14.40 | $782,162 | ($390,000) | $392,162 | 7.8% |
| Year 3 | 94% | 61,664 | $15.25 | $865,146 | ($390,000) | $475,146 | 9.4% |
| Year 4 | 94% | 61,664 | $15.83 | $898,050 | ($455,089) | $442,961 | 8.8% |
| Year 5 | 94% | 61,664 | $15.95 | $904,858 | ($455,089) | $449,769 | 8.9% |
CoC = cash-on-cash return on equity. Debt service is interest-only for three years, then amortising over 30 years. Figures are illustrative and computed from the assumptions above.
Where the income goes, year by year
Each column is that year's net operating income, split into the debt service it must cover and the cash flow left for equity. Debt service steps up in year four when the interest-only period ends.
- Cash flow to equity
- Debt service
Column height is net operating income. The full figures are in the table above.
Exit
A sale in year five, priced off forward income.
The exit is underwritten at a capitalisation rate above the going-in yield on cost — we do not assume the market re-rates in our favour.
- Hold period
- 5 years
- Forward NOI at exit
- $932,003
- Exit capitalisation rate
- 7.50% (+60 bp vs going-in)
- Gross sale value
- $12,426,710
- Selling costs (1.5%)
- ($186,401)
- Loan balance repaid
- ($5,861,382)
- Net proceeds to equity
- $6,378,928
Illustrative Outcome
Two cases, not one.
A single scenario tells you what someone hopes will happen. The pair below is the same asset under a base case and under slower execution in a less favourable capital market. Neither is a forecast.
Illustrative base case
12.2%
Levered IRR
- Equity multiple
- 1.67x
- Average cash-on-cash
- 8.2%
- Going-in cap
- 6.90%
- Exit cap
- 7.50% (+60 bp)
Lease-up proceeds as planned, in-place rents roll toward market over the hold, and the asset is sold at a capitalisation rate above the going-in yield.
Downside case
-1.0%
Levered IRR
- Equity multiple
- 0.96x
- Average cash-on-cash
- 5.3%
- Going-in cap
- 6.55%
- Exit cap
- 8.25% (+170 bp)
Execution is slower and the capital markets are less favourable: occupancy stabilises lower, less of the mark-to-market is captured, operating costs run heavier, debt costs more and the asset exits at a materially wider capitalisation rate.
Where the return comes from
Both cases exit wider than they enter — the base case gives back +60 bp of valuation, the downside +170 bp. Nothing in either result depends on the market re-rating the asset upward. What is left is income: net operating income rising from $689,974 to $904,858 in the base case through occupancy and rent, against a cost of debt that stays fixed.
The downside is the honest half. Six points of occupancy, a slower mark-to-market, a heavier expense load, 0.75% more on debt and 75 bp of additional exit widening take the result to -1.0% and a 0.96x multiple. That is close to capital back and no more. We would rather show you that than a single flattering line.
Levered, before any sponsor promote, asset management fee, partnership expense or tax. A real transaction carries all of those and they reduce investor-level returns.
The Two Cases
What changes between them.
Every difference between the two outcomes above is an assumption listed here. Nothing else moves.
| Assumption | Base case | Downside |
|---|---|---|
| Stabilised occupancy | 94% | 88% |
| Rent achieved by year 5 | $15.95 | $14.75 |
| Non-recoverable + management | 8.0% | 10.5% |
| Interest rate | 6.50% | 7.25% |
| Exit capitalisation rate | 7.50% | 8.25% |
| Exit vs going-in | +60 bp | +170 bp |
| Resulting outcome | ||
| Going-in cap rate | 6.90% | 6.55% |
| Stabilised yield on cost | 7.84% | 6.72% |
| Average cash-on-cash | 8.2% | 5.3% |
| Equity multiple | 1.67x | 0.96x |
| Levered IRR | 12.2% | -1.0% |
Basis
The same asset across a $145 to $160 per SF range.
Base-case assumptions throughout — only the entry price moves. This is what we mean by basis before narrative.
A $15 per SF swing in entry price — about 10% — moves the illustrative levered IRR by roughly 4 points. No amount of operating skill recovers a basis mistake of that size.
Sensitivity
The exit assumption does most of the work.
Which is why we underwrite it conservatively and why any single-point return figure should be treated sceptically — including this one.
Illustrative IRR by exit capitalisation rate
Every other assumption held constant. The spread between the best and worst rows here is wider than most of the operating decisions we actually control — which is the point.
The highlighted row is the base case used throughout this page.
Reading This Honestly
What a model like this cannot tell you.
It assumes the lease-up happens
Occupancy rising from 85% to 94% is an assumption, not a fact. If the local tenant base is thinner than underwritten, the entire schedule moves.
It assumes rents roll to market
In-place rents below market are only an opportunity if leases actually expire and tenants actually pay the new rate.
It ignores fees and promote
Returns are shown before sponsor compensation, partnership expenses and tax. Investor-level outcomes are lower.
It is a single scenario
There is no downside case here. A real investment committee memorandum would carry several, including one where nothing goes right.
Again, for the avoidance of doubt. The asset above does not exist. These figures are illustrative, are not a projection or a target, do not describe any offering, and must not be relied upon. Any actual investment would be offered only to qualified investors by means of definitive offering documents containing complete information about terms, risks, fees and conflicts of interest.
Investors & Capital Partners
Want to walk through the underwriting?
We are happy to talk through how we build these models, which assumptions we argue about most, and where we think this segment can disappoint.